The differential diagnosis for T-wave inversions is broad and includes, but is not limited to: ischemia, hypertrophy, bundle branch blocks, early repolarization variants, persistent juvenille T wave pattern, cardiac memory, electrolyte disturbances like hypokalemia, and increased intracranial pressure.
T-wave Inversions

Examples
T-wave Inversions
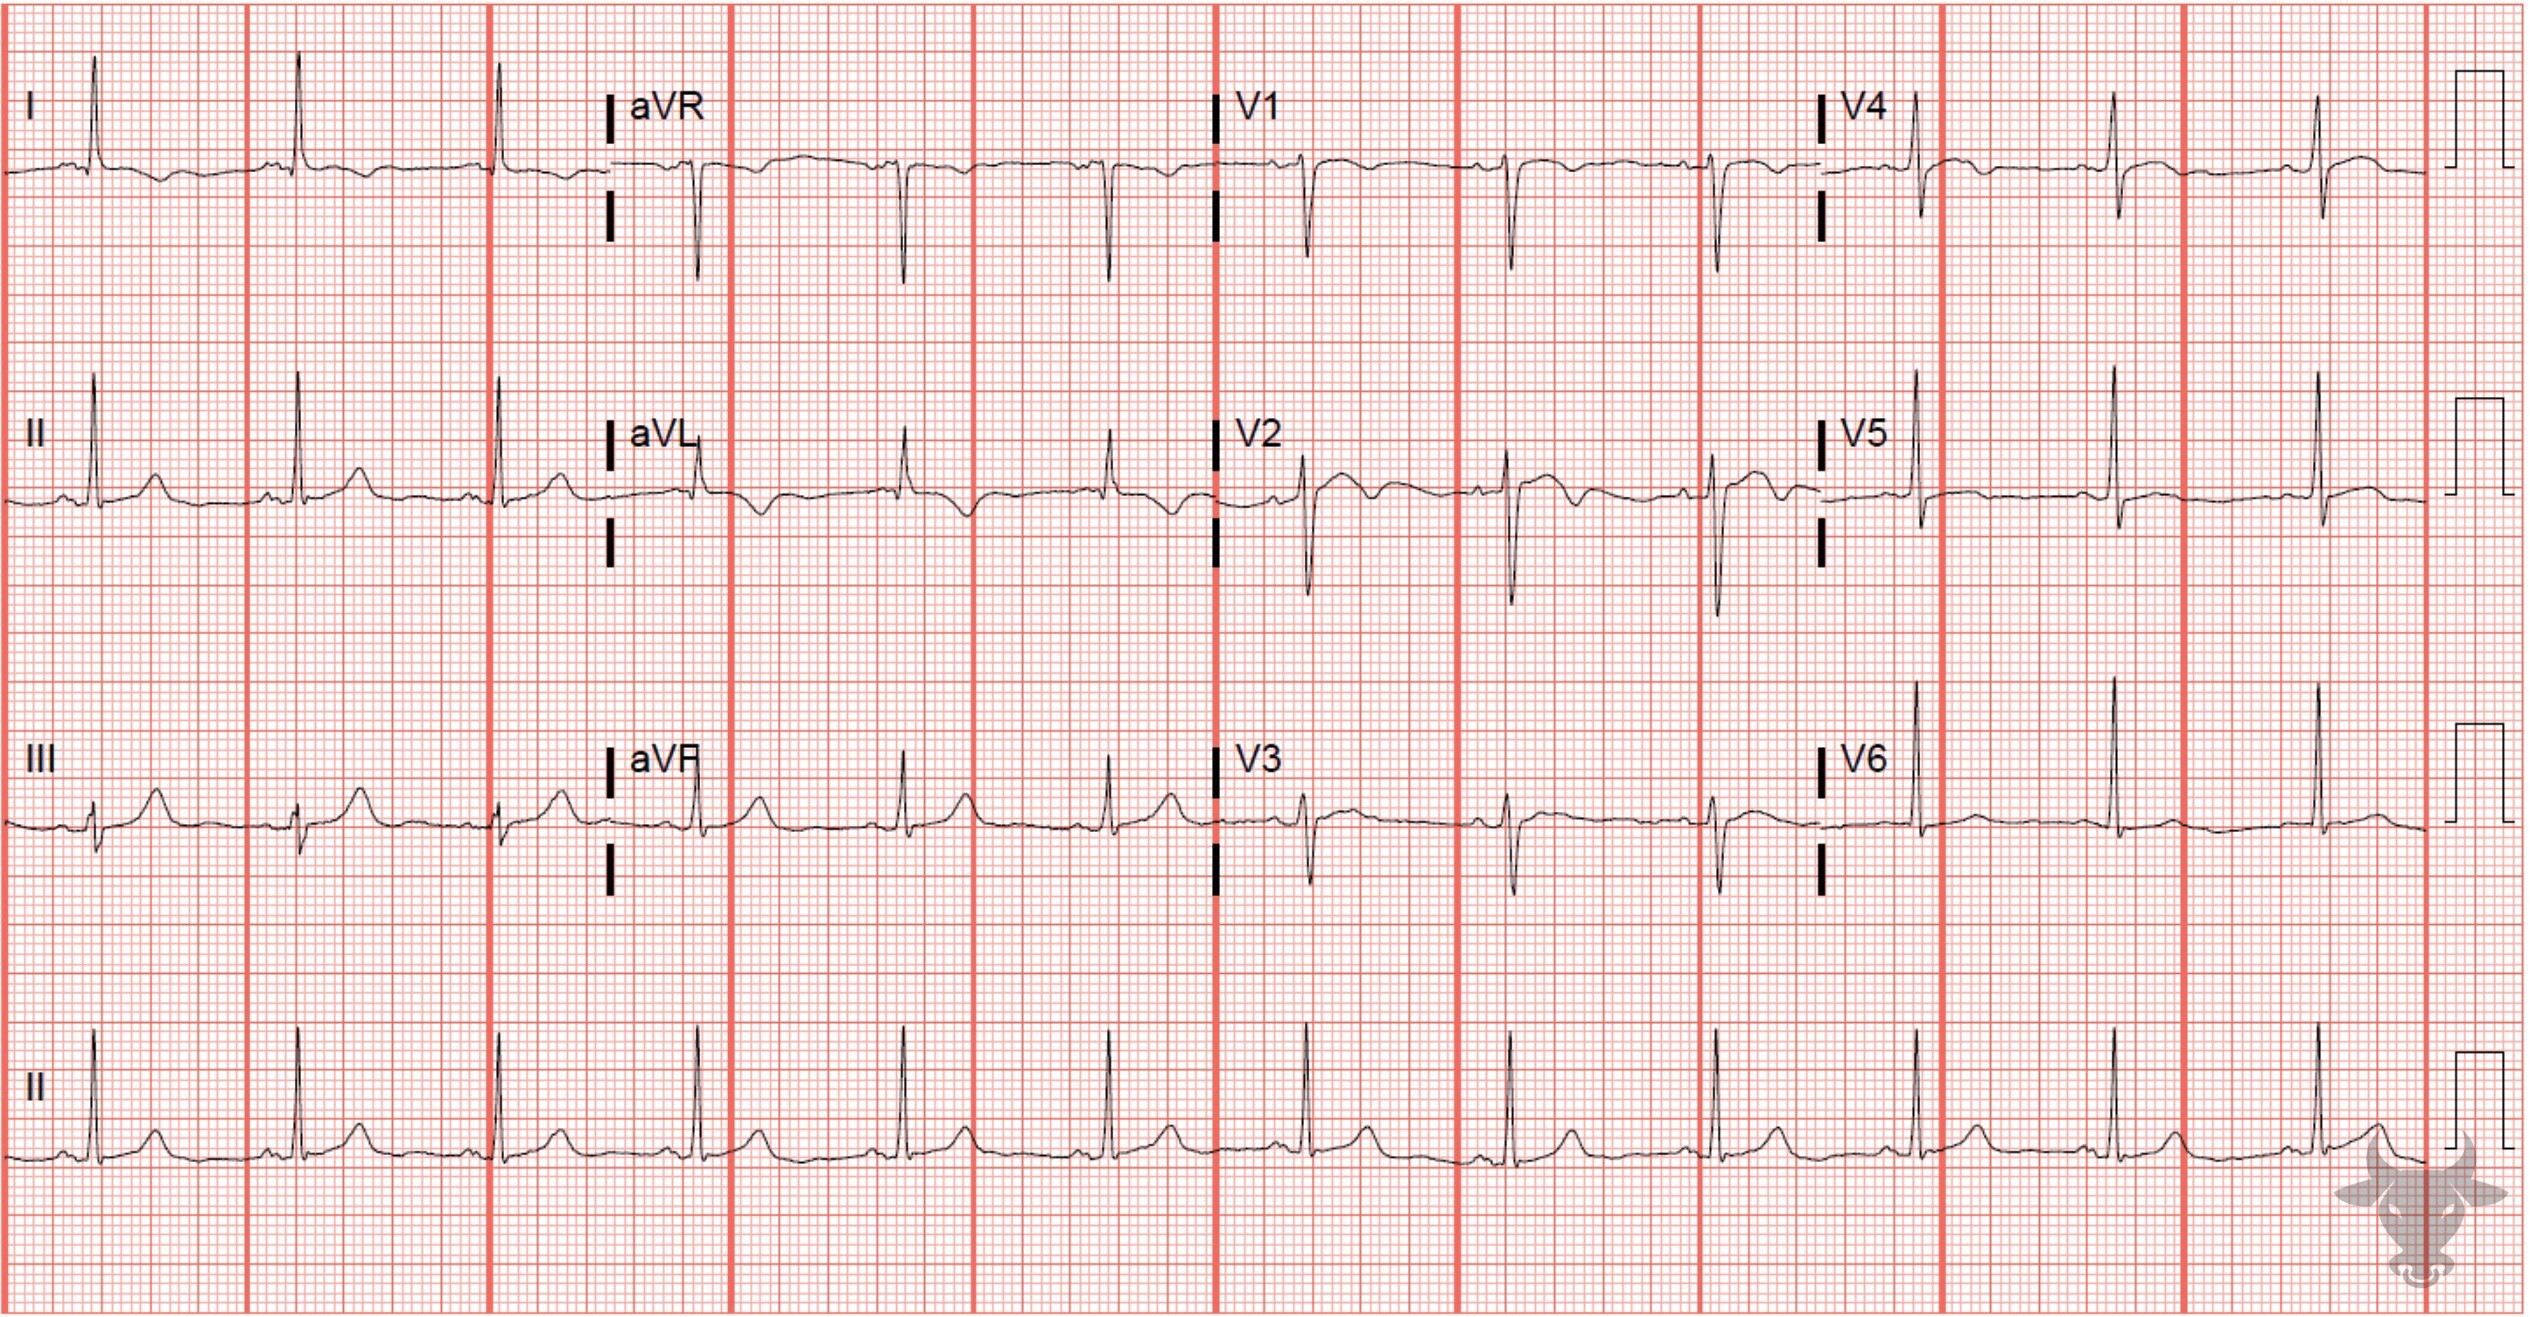
The symmetric morphology of the T wave inversions seen in I, aVL, and V2 (biphasic with negative terminal deflection) suggest ischemia. Left heart catheterization revealed 95% mid-left anterior descending artery stenosis.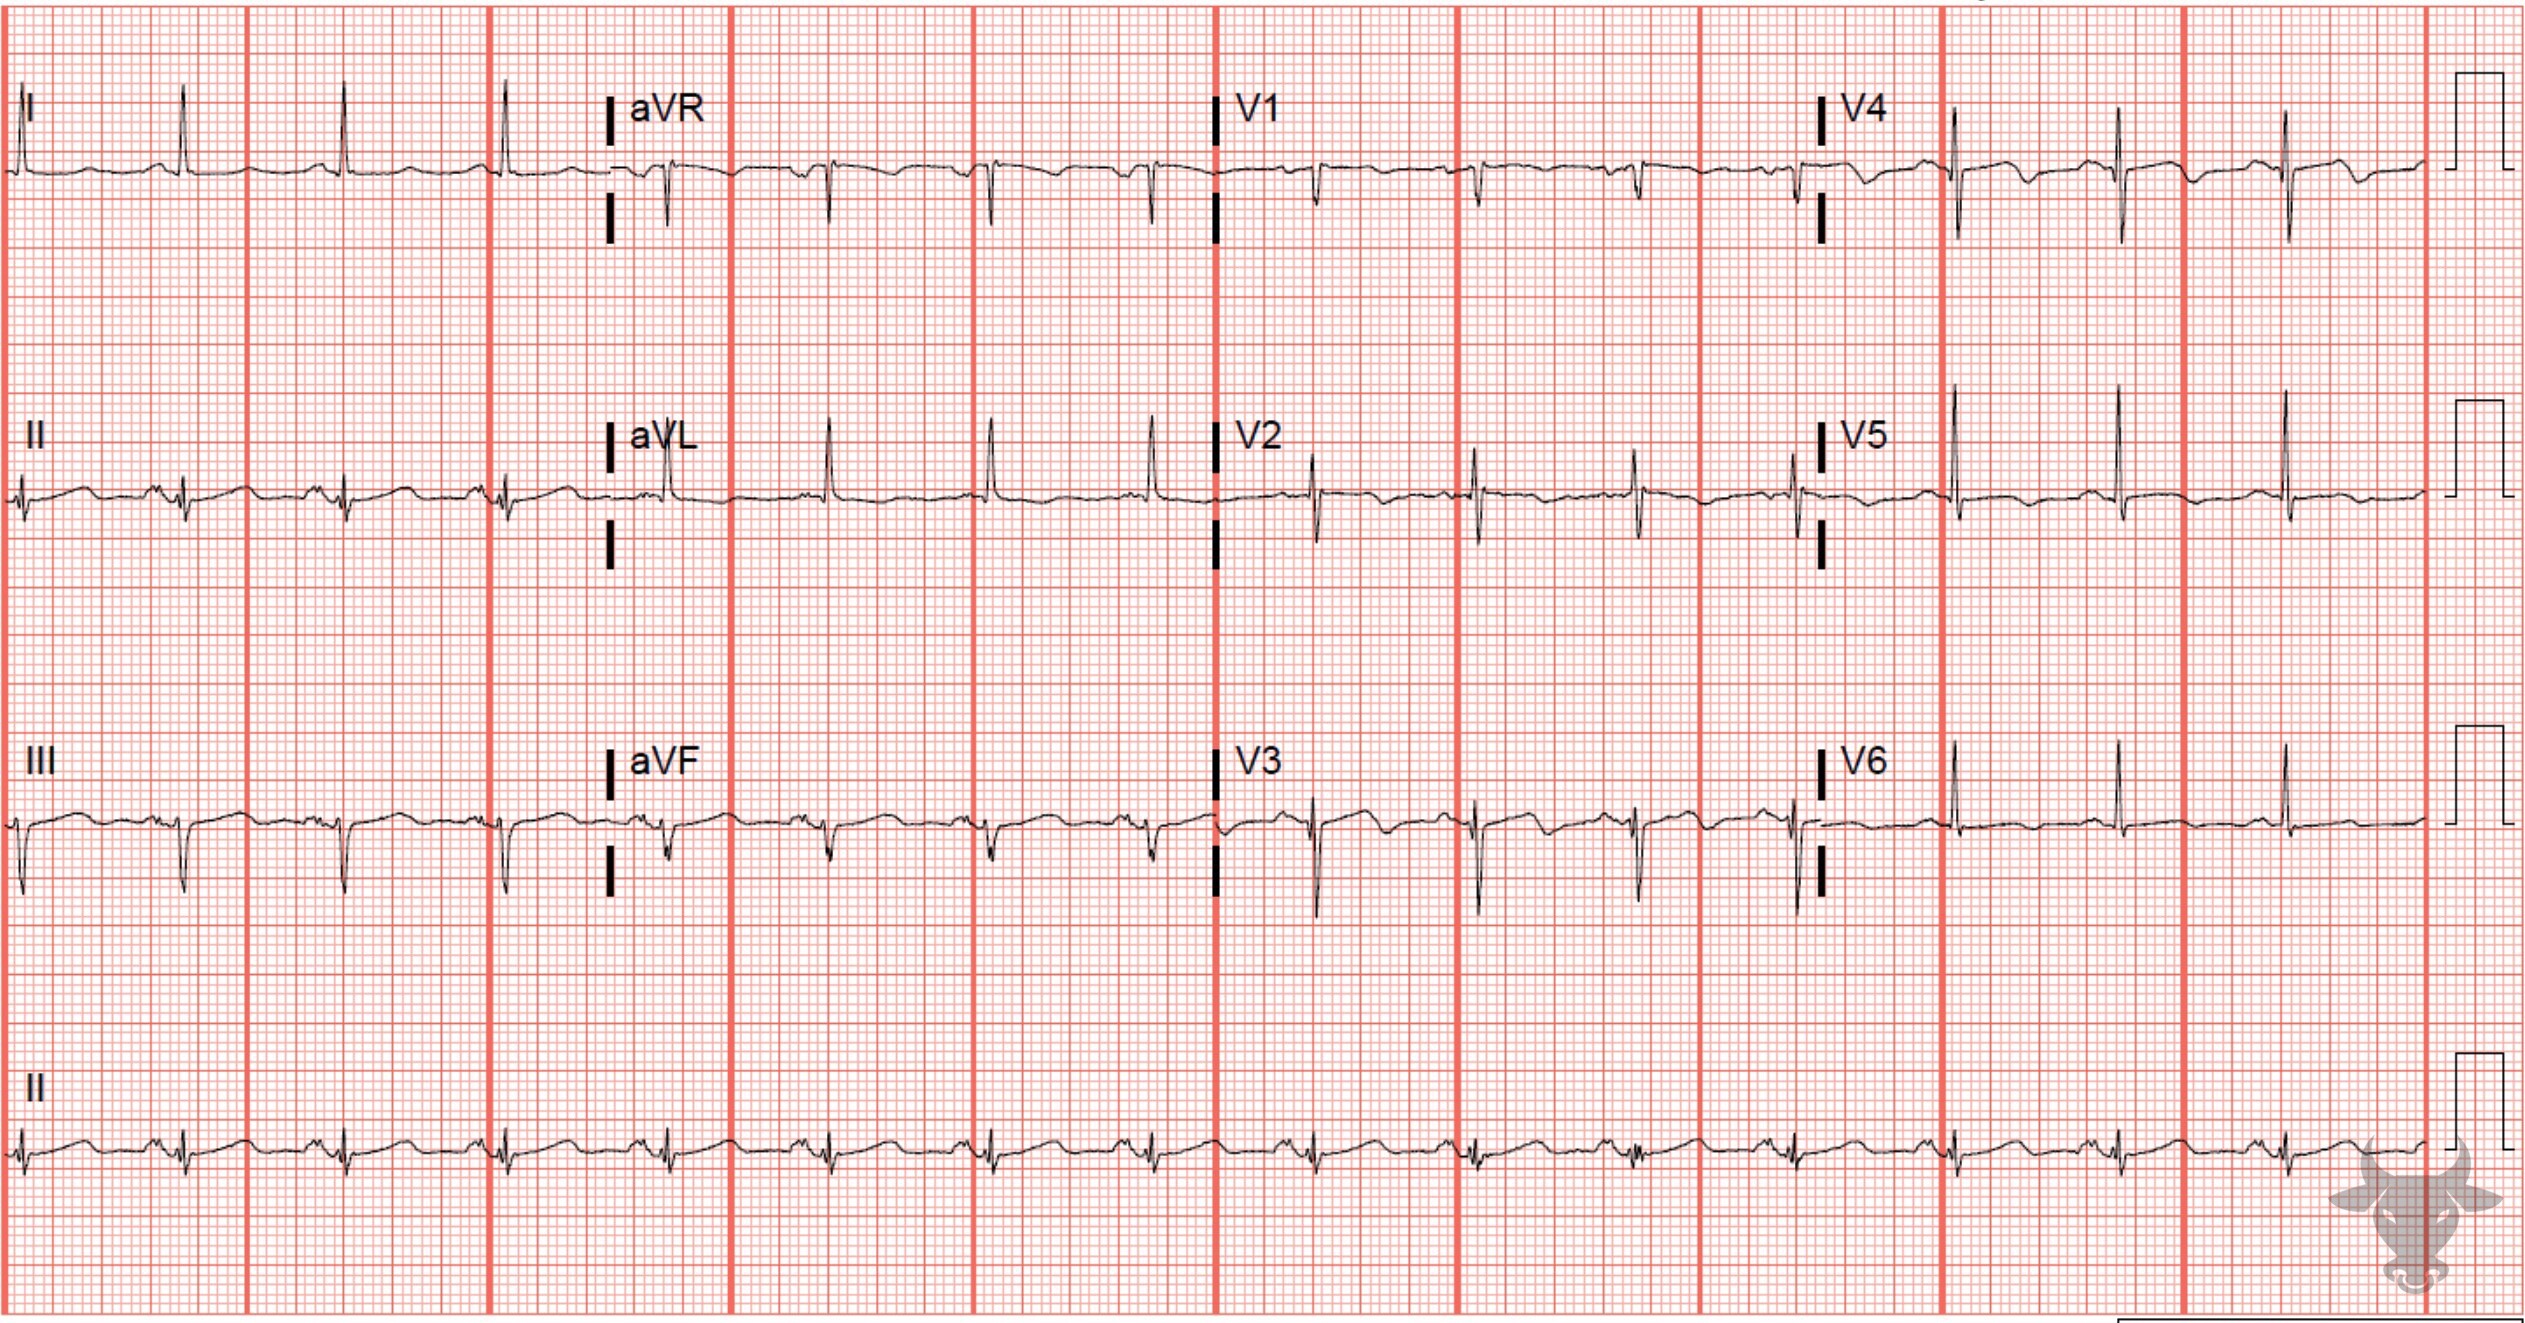
T-wave Inversions
Left heart catheterization revealed 99% proximal left anterior descending artery stenosis.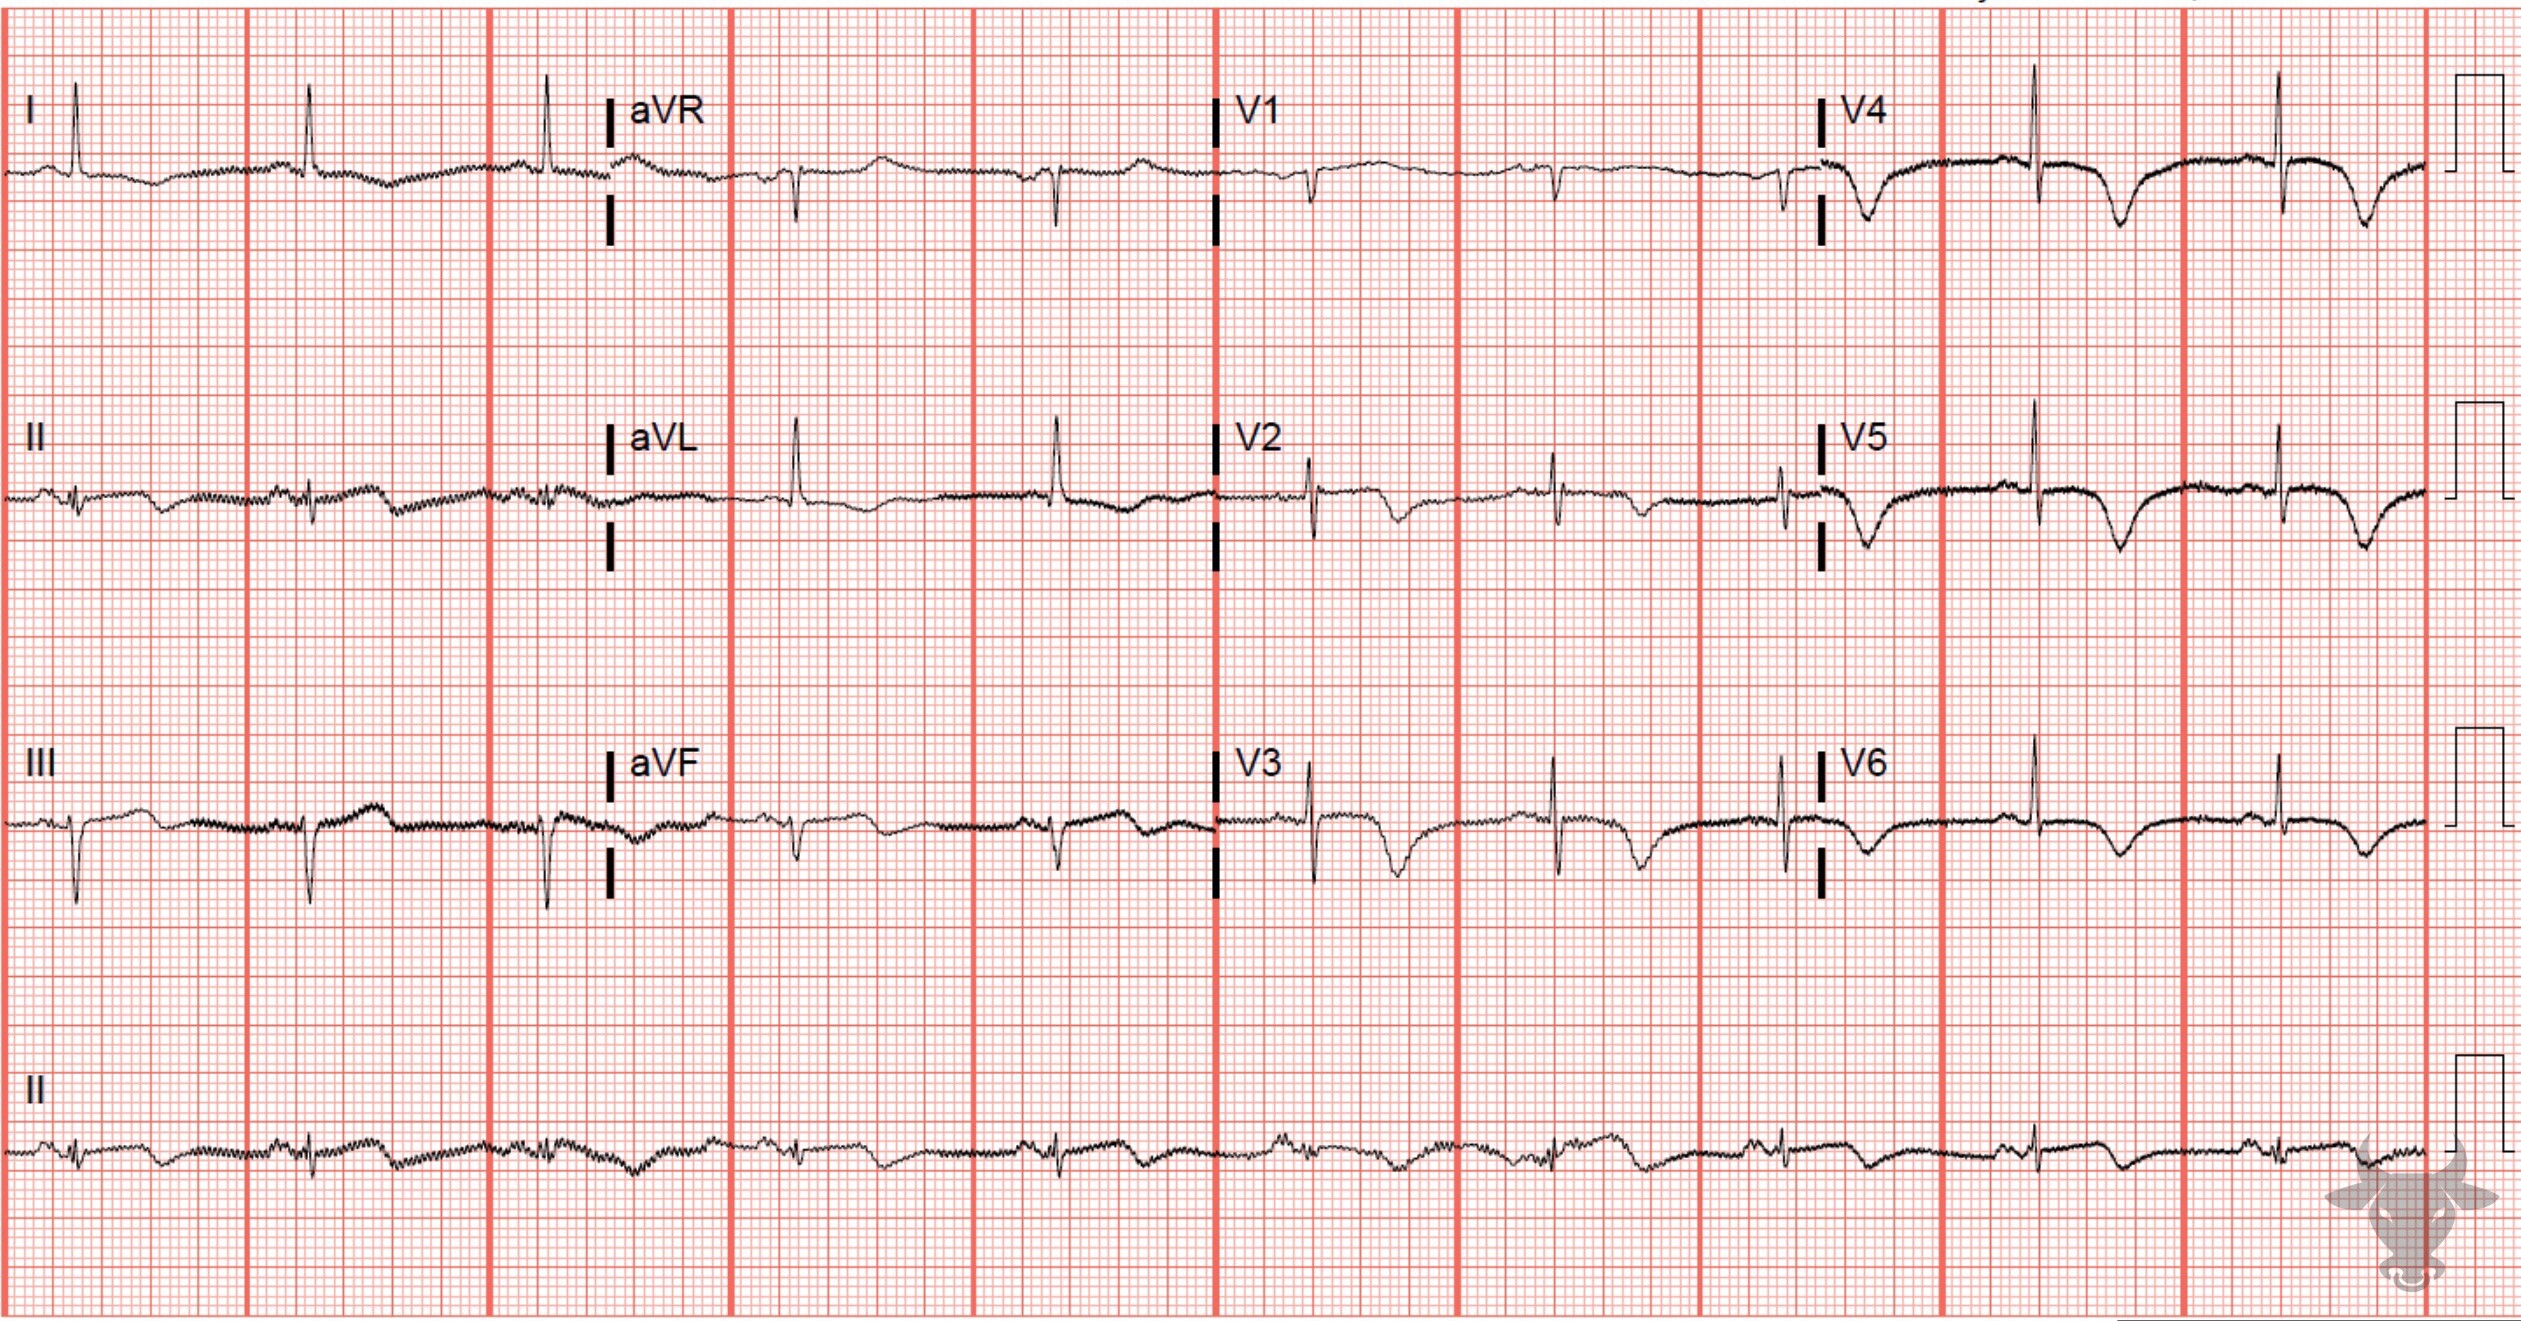
T-wave Inversions
Left heart catheterization revealed 99% proximal left anterior descending artery stenosis.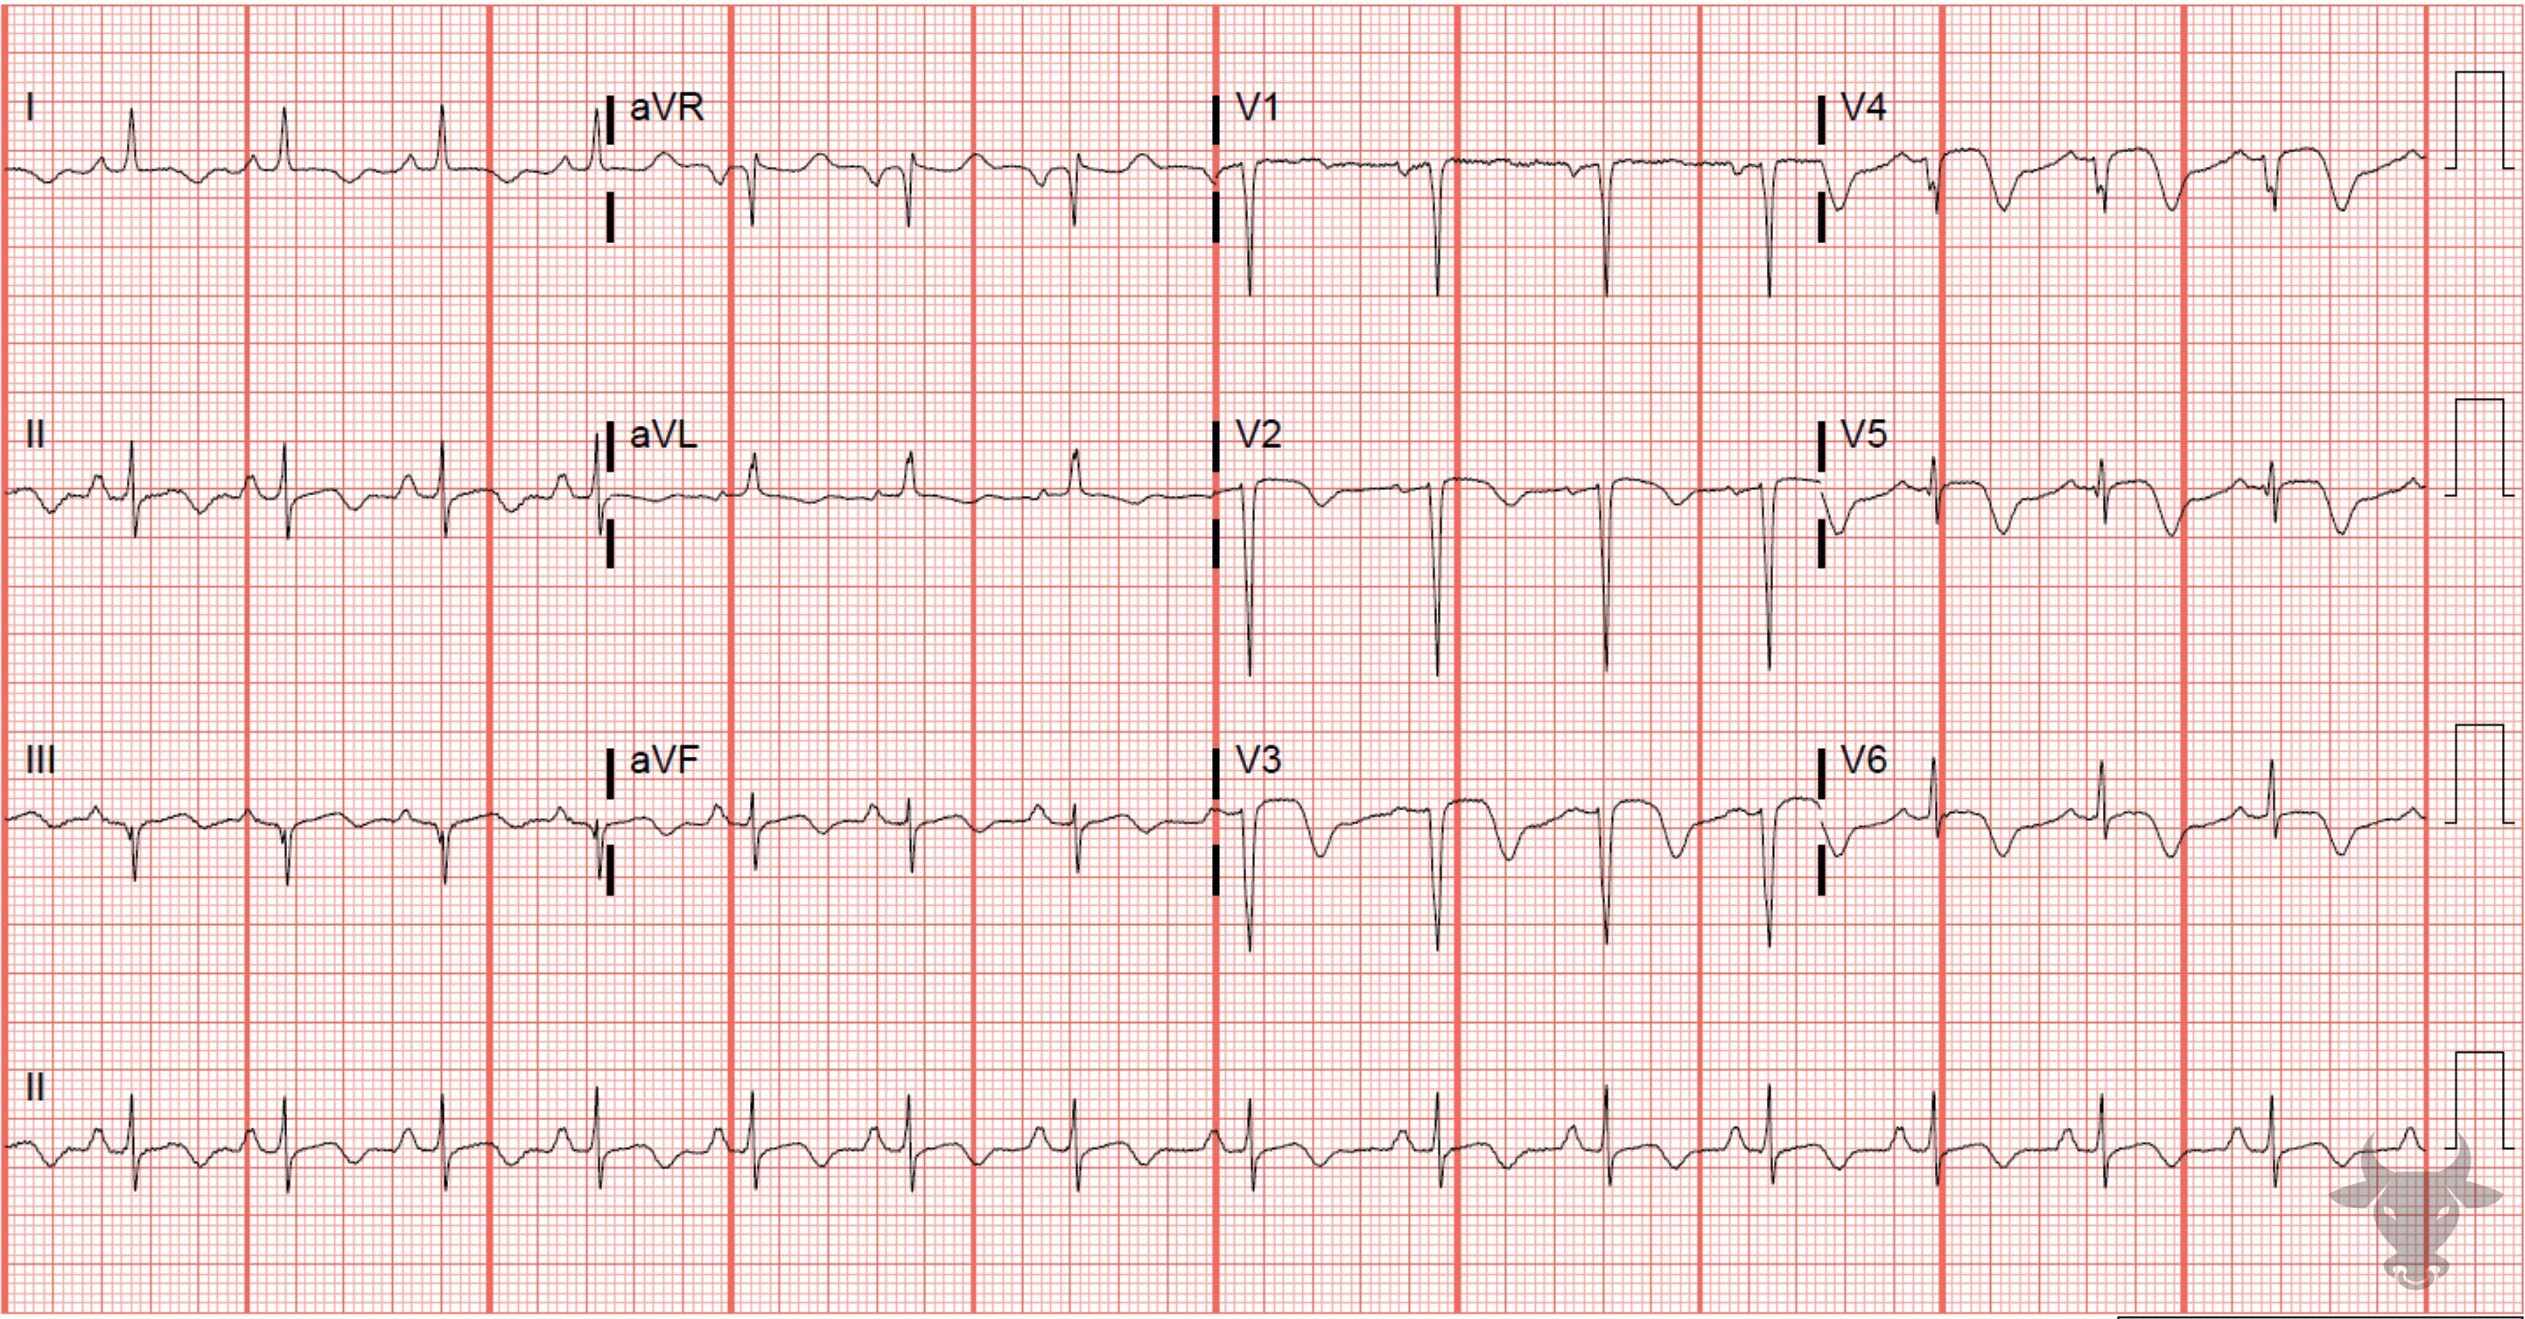
T-wave Inversions
The repolarization abnormalities seen here represent "reperfusion T waves." This ECG was performed immediately after percutaneous coronary intervention of the left anterior descending artery. Reperfusion T waves are expected repolarization changes associated with reperfusion. They can be seen, also, with unstable lesions representing ischemia (i.e., Wellens syndrome).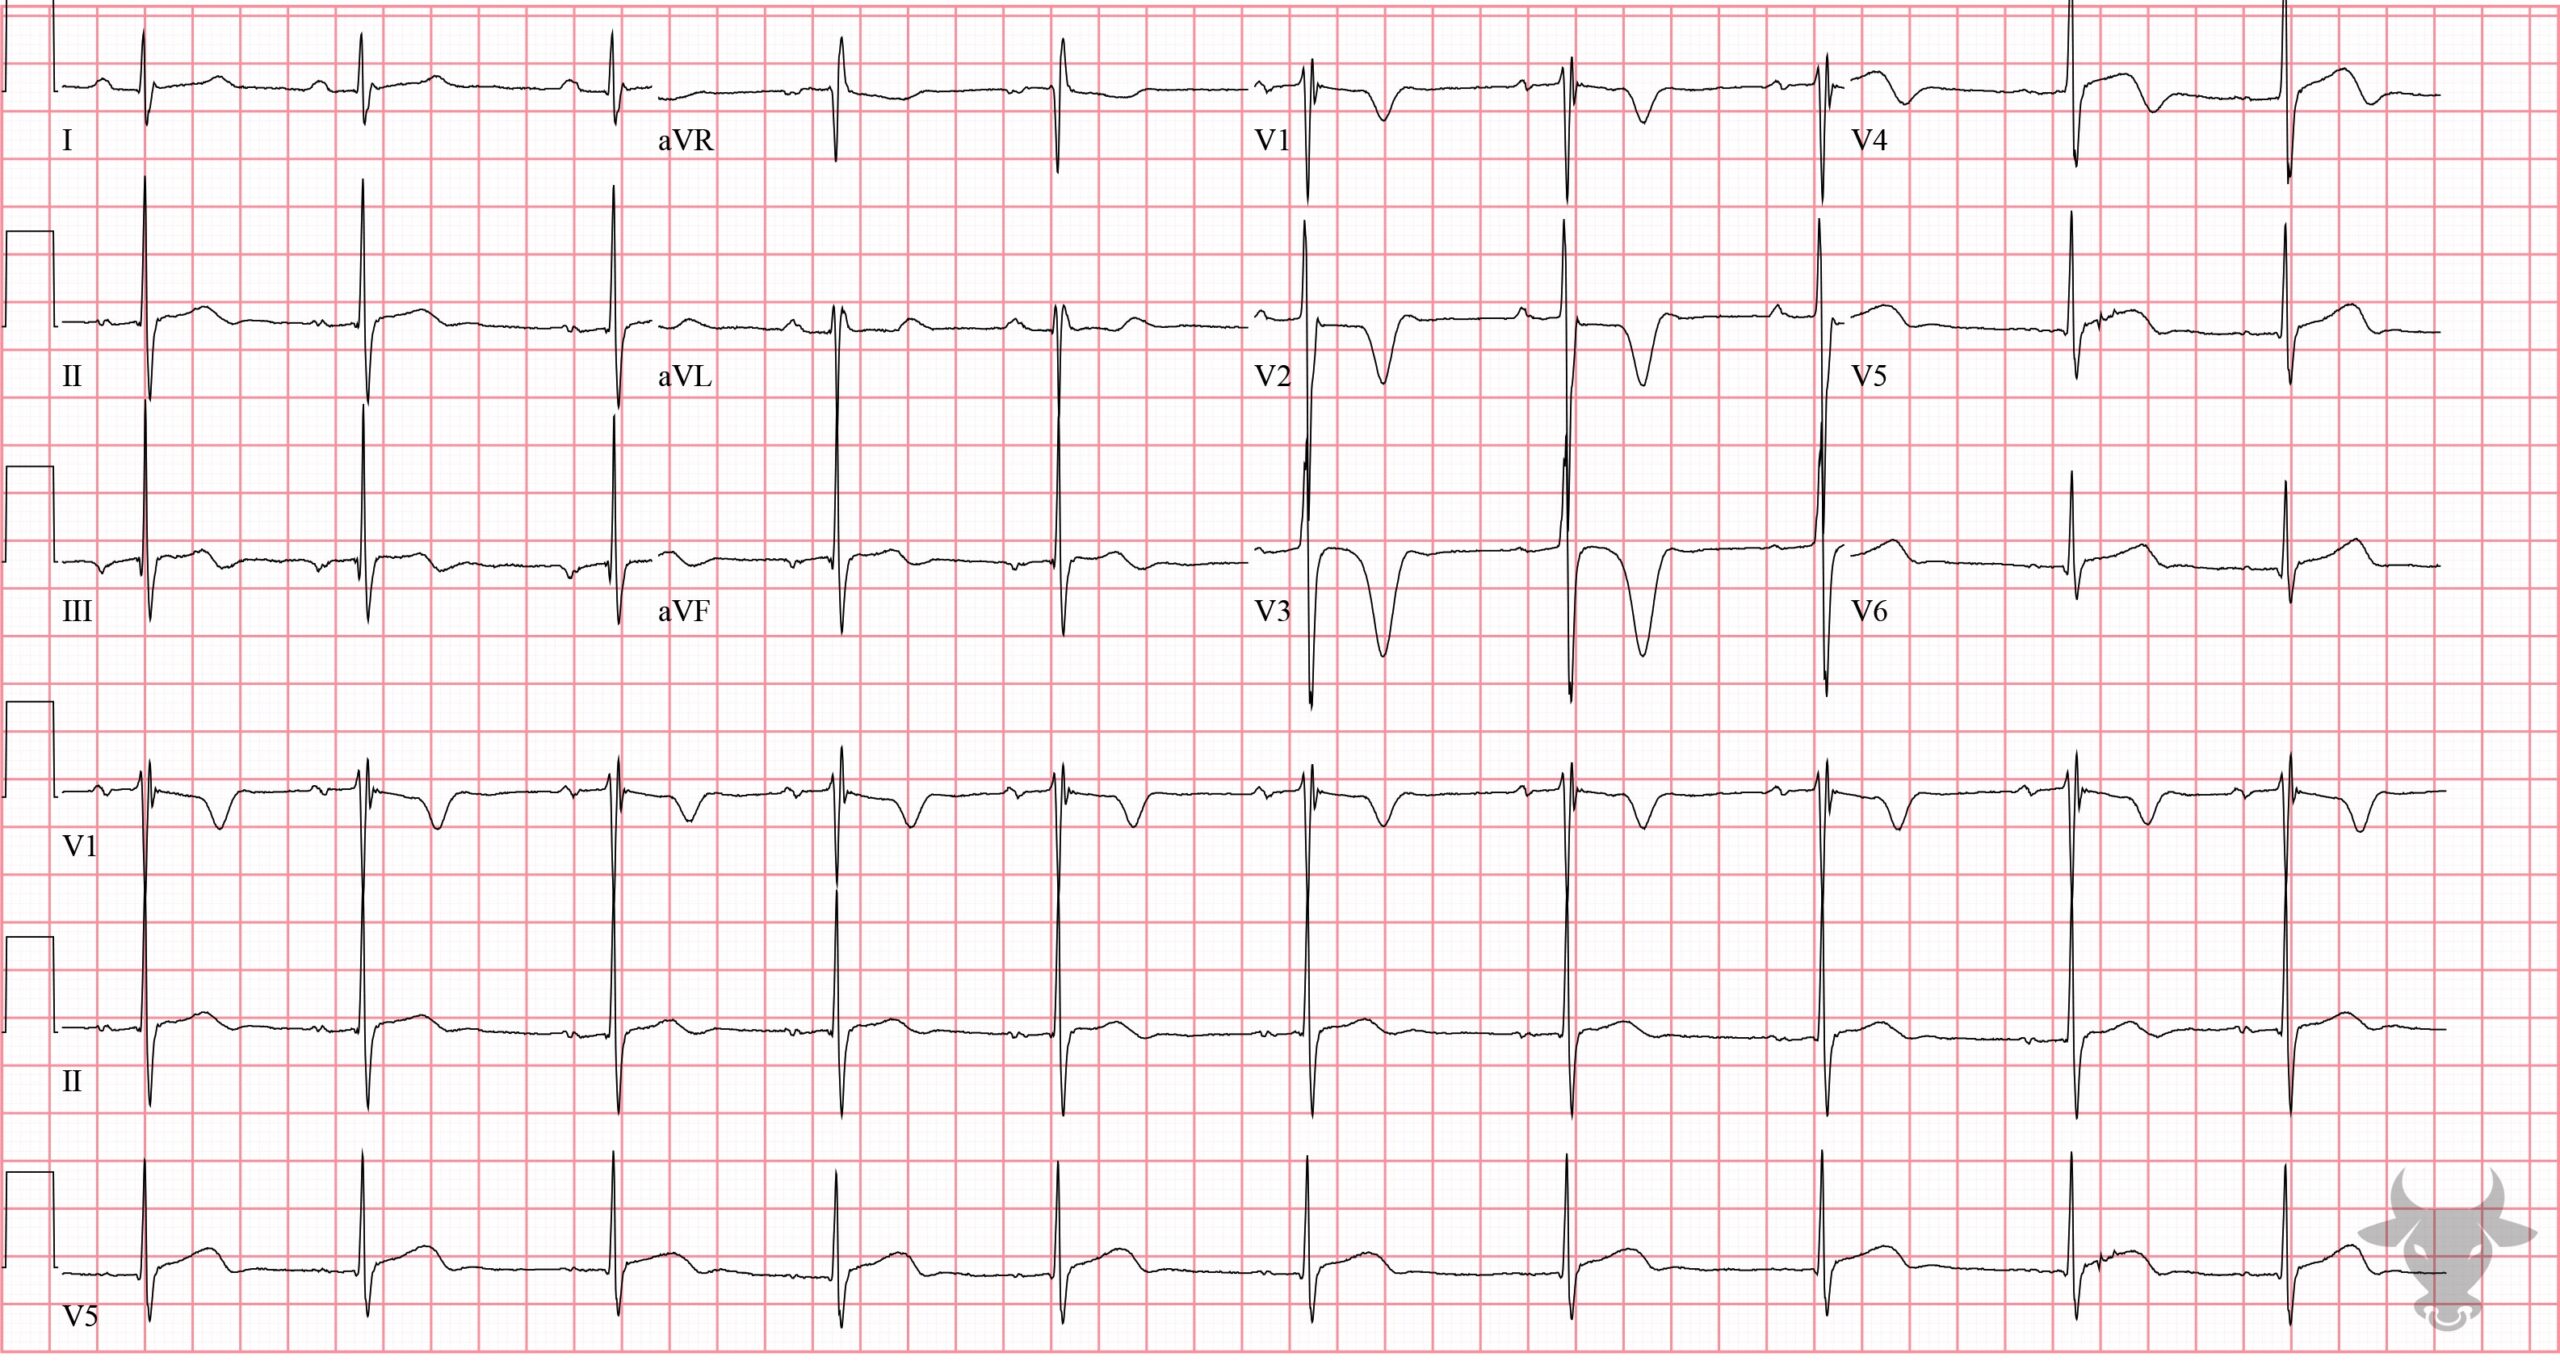
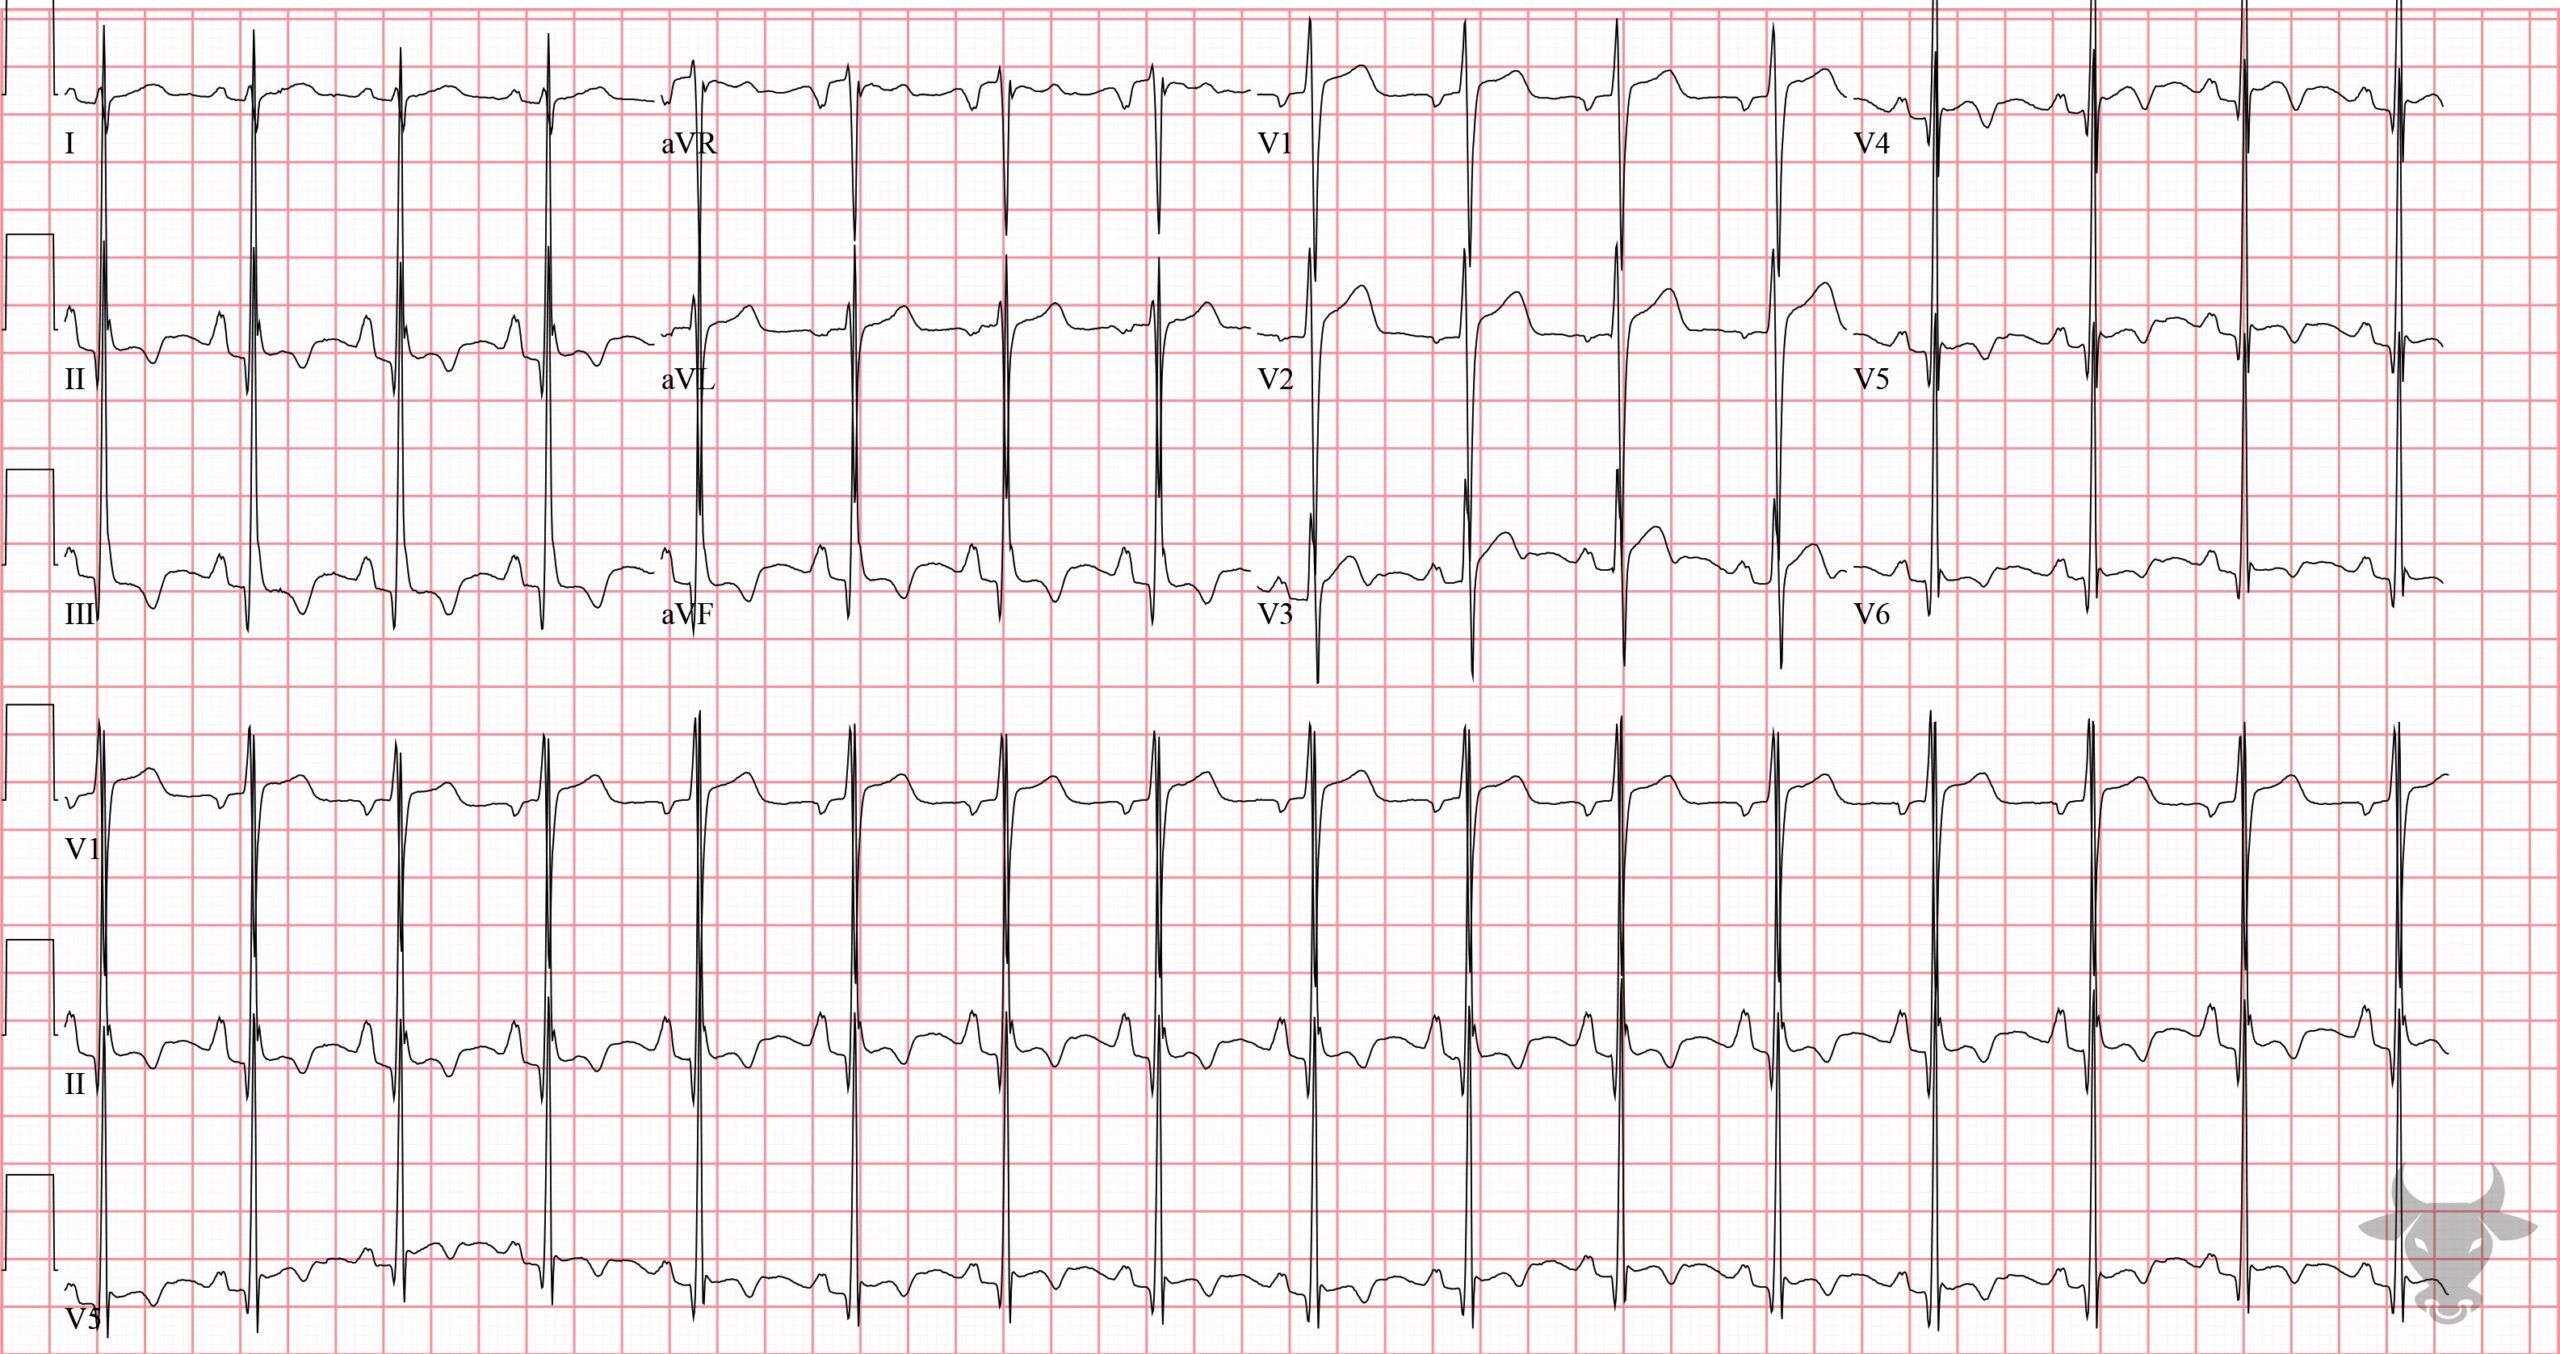
Hypertrophic Cardiomyopathy
Hypertrophic cardiomyopathy can have a variable appearance and it's not uncommon to see repolarization abnormalities like the ones seen here.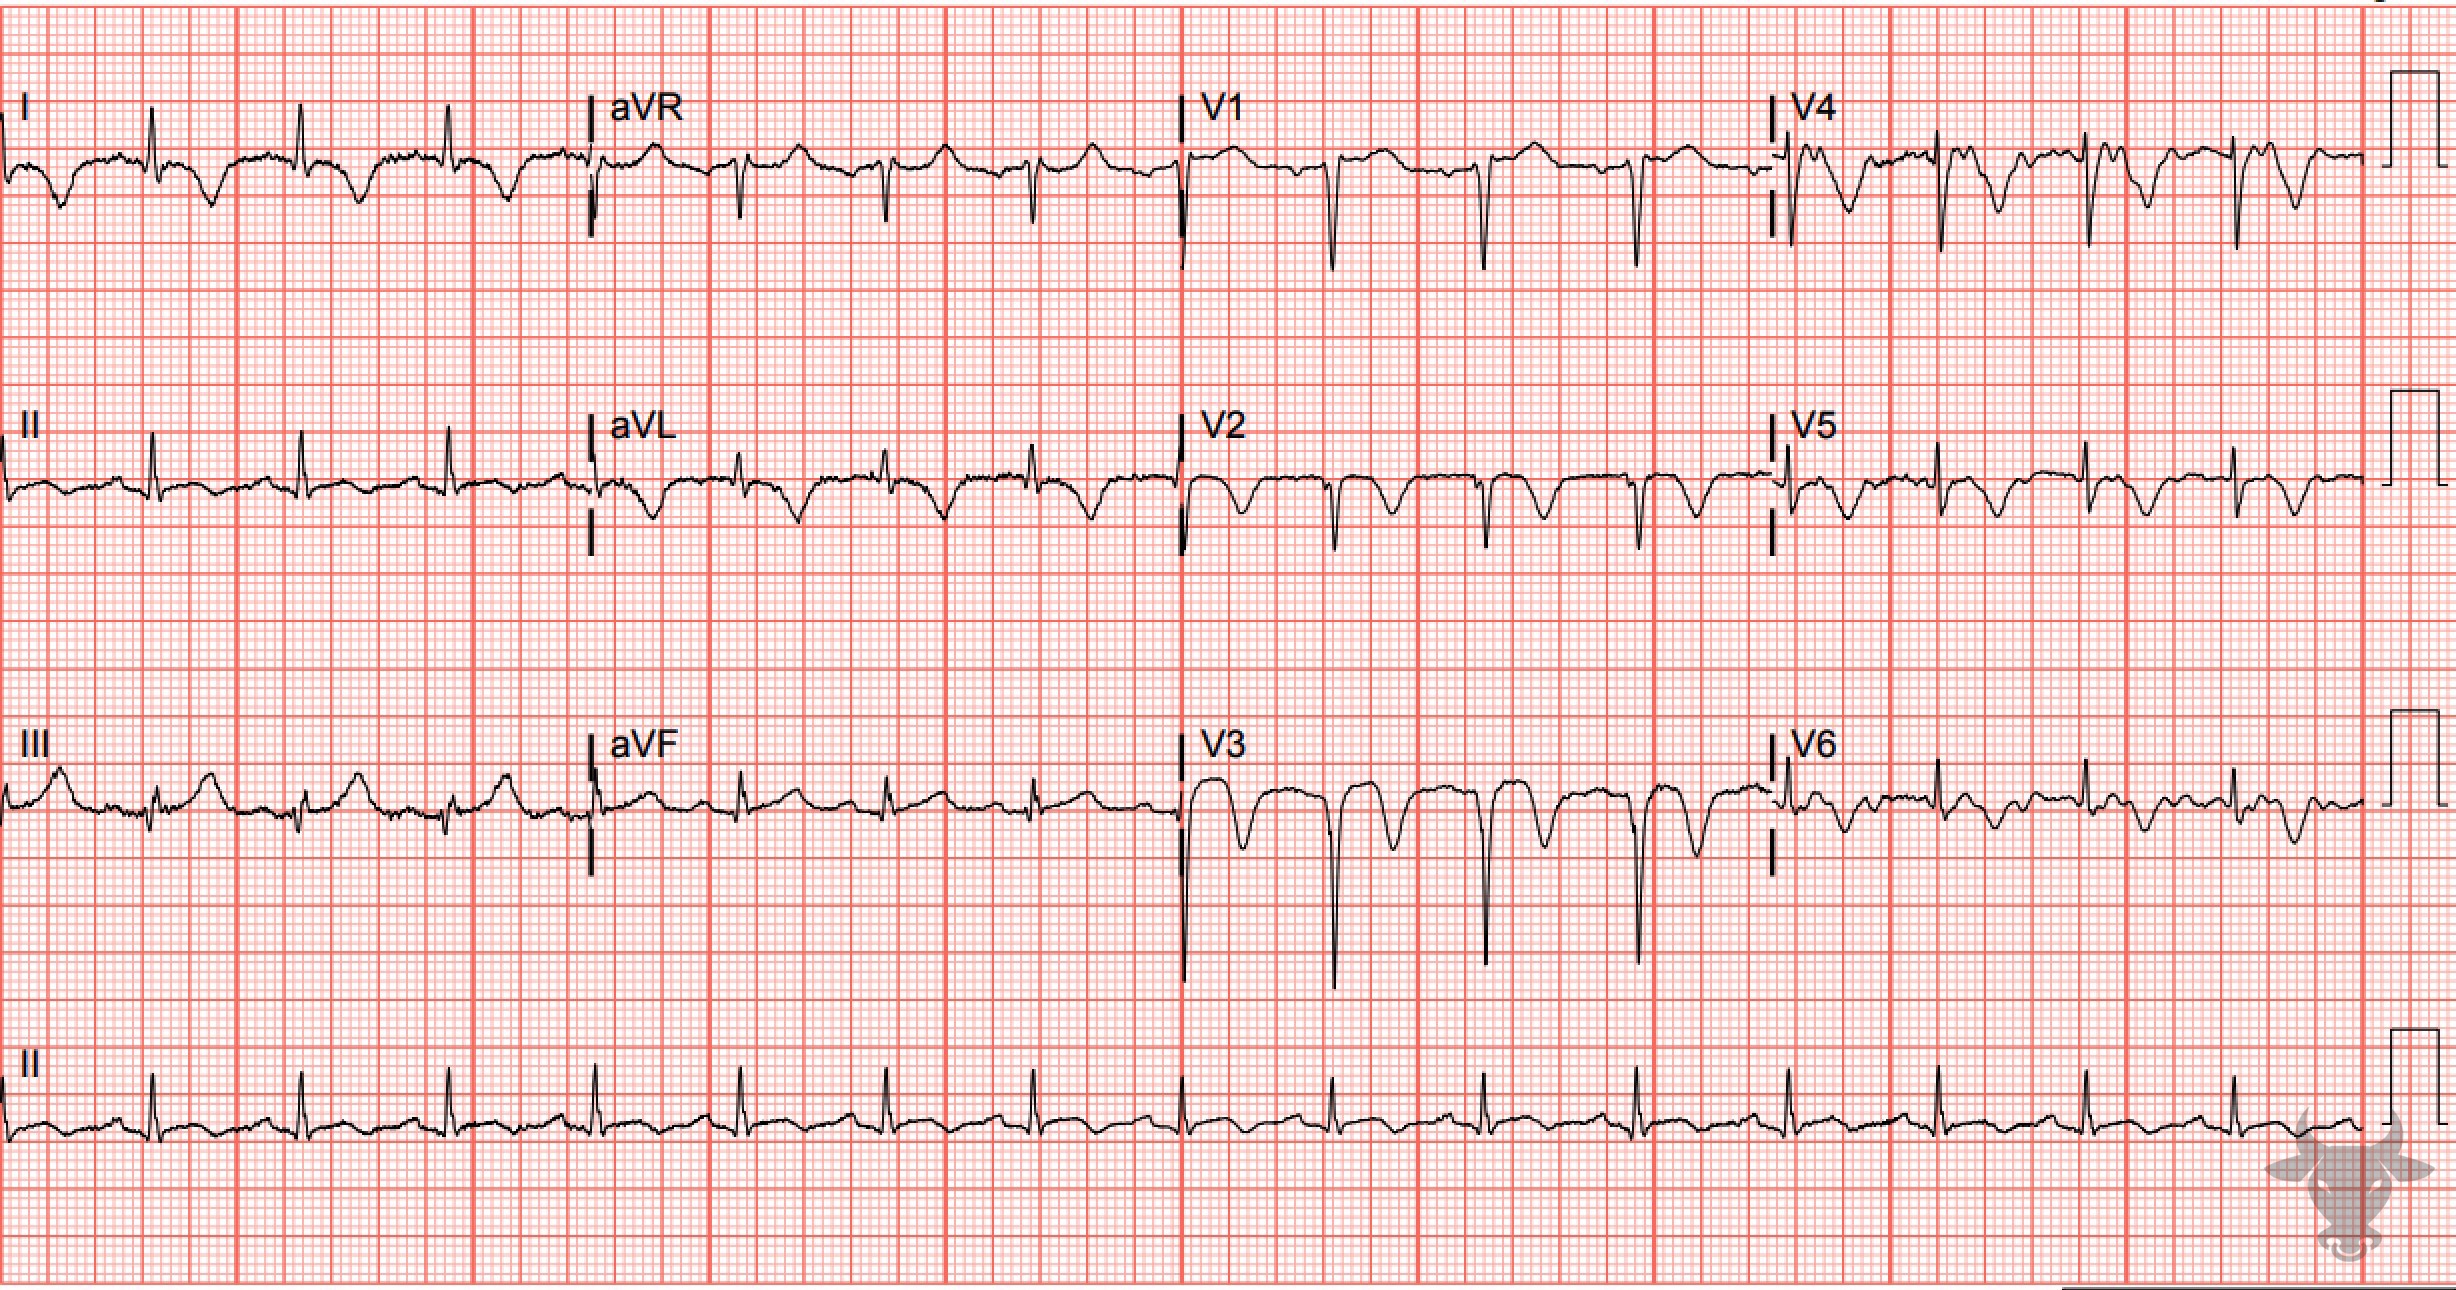
Wellens Syndrome
This is type B Wellens pattern with deeply inverted precordial T waves. This patient had a 95% proximal left anterior descending stenosis.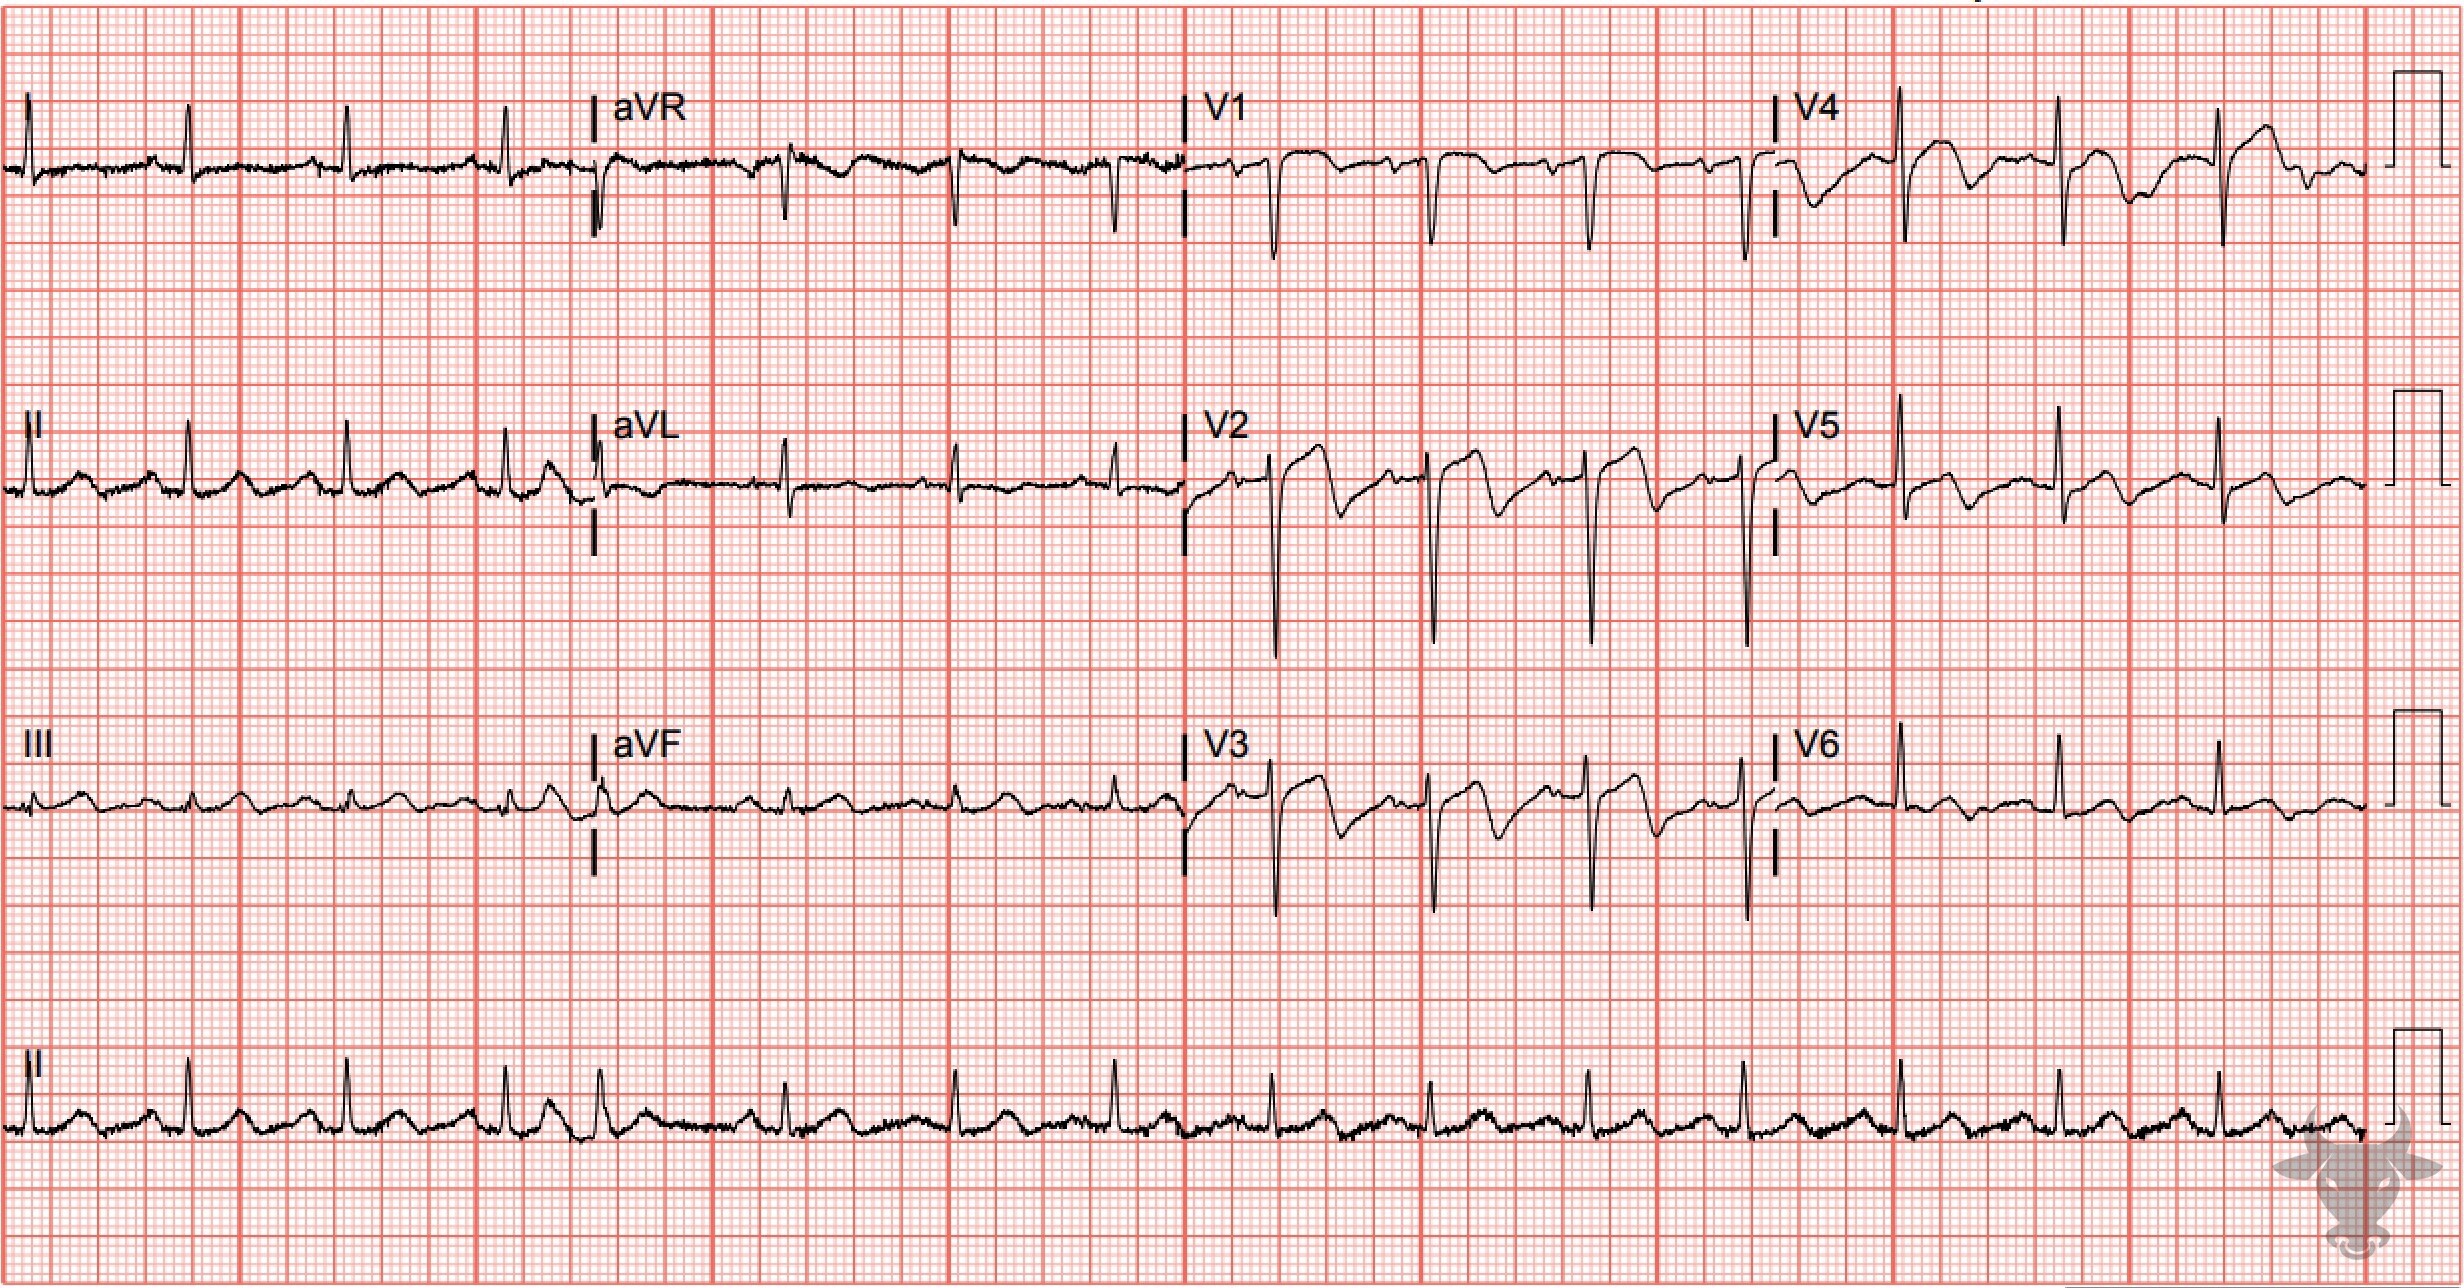
Wellens Syndrome
This is a type A Wellens pattern with biphasic T waves that have negative terminal deflections. This patient had a 90% proximal left anterior descending artery stenosis.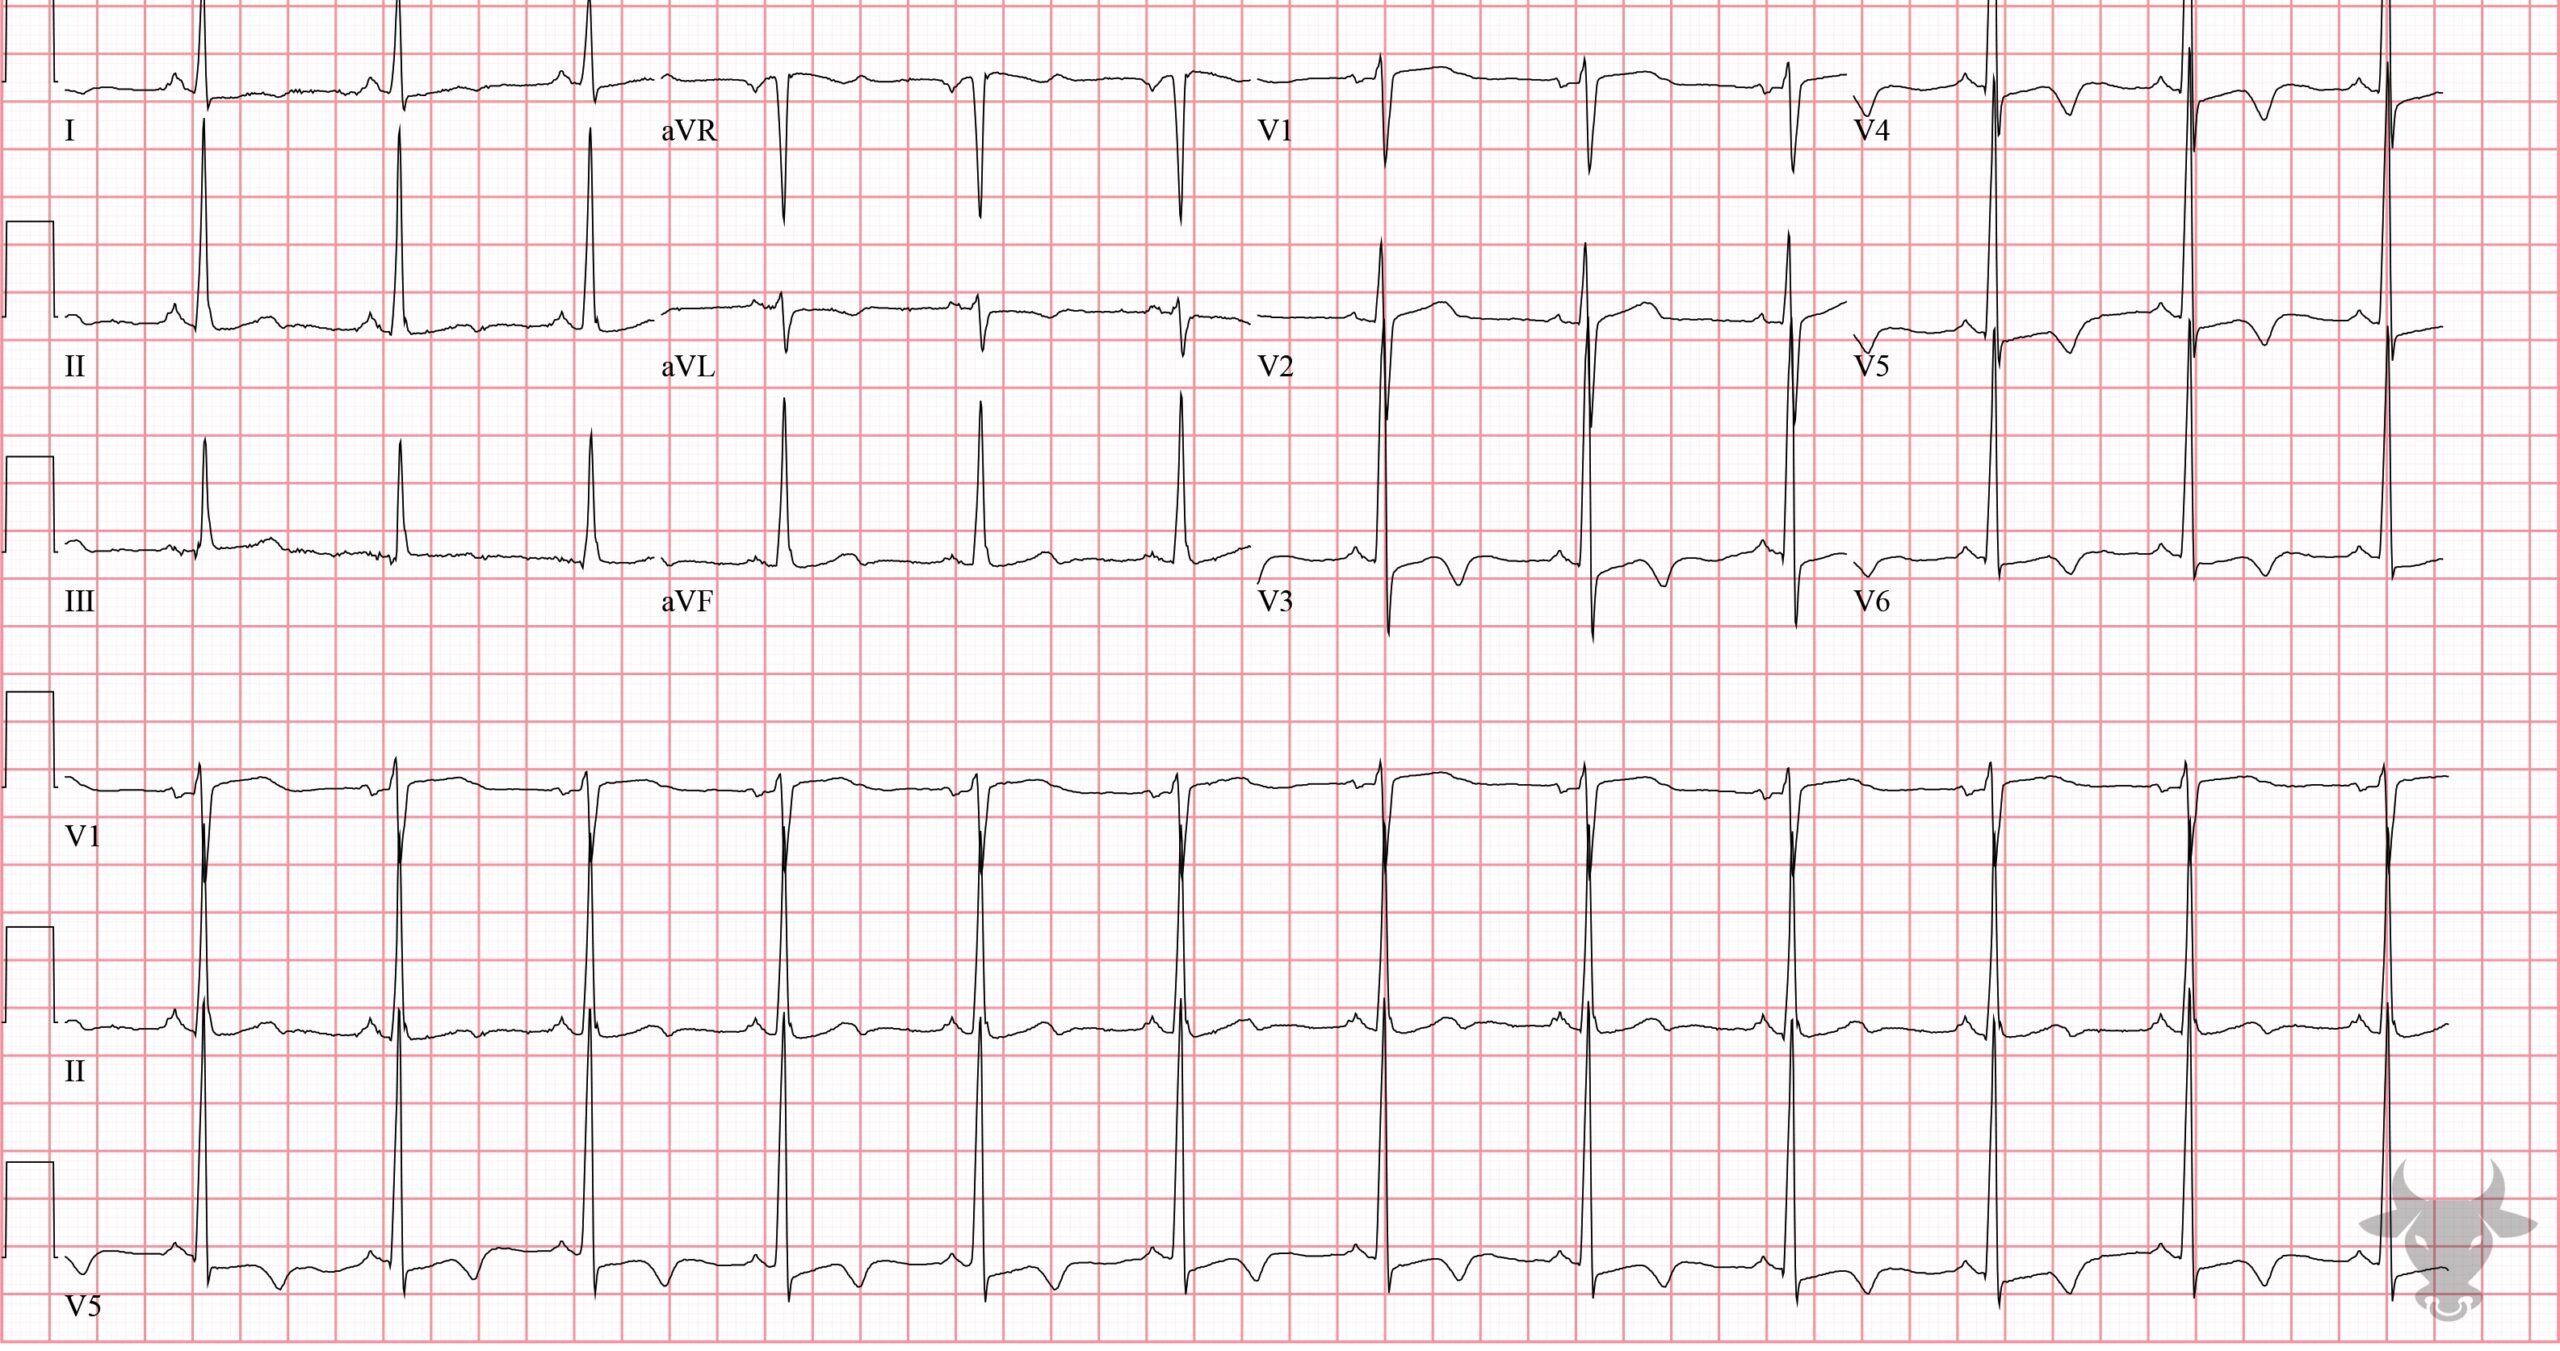
Hypertrophic Cardiomyopathy
This patient had known apical hypertrophic cardiomyopathy.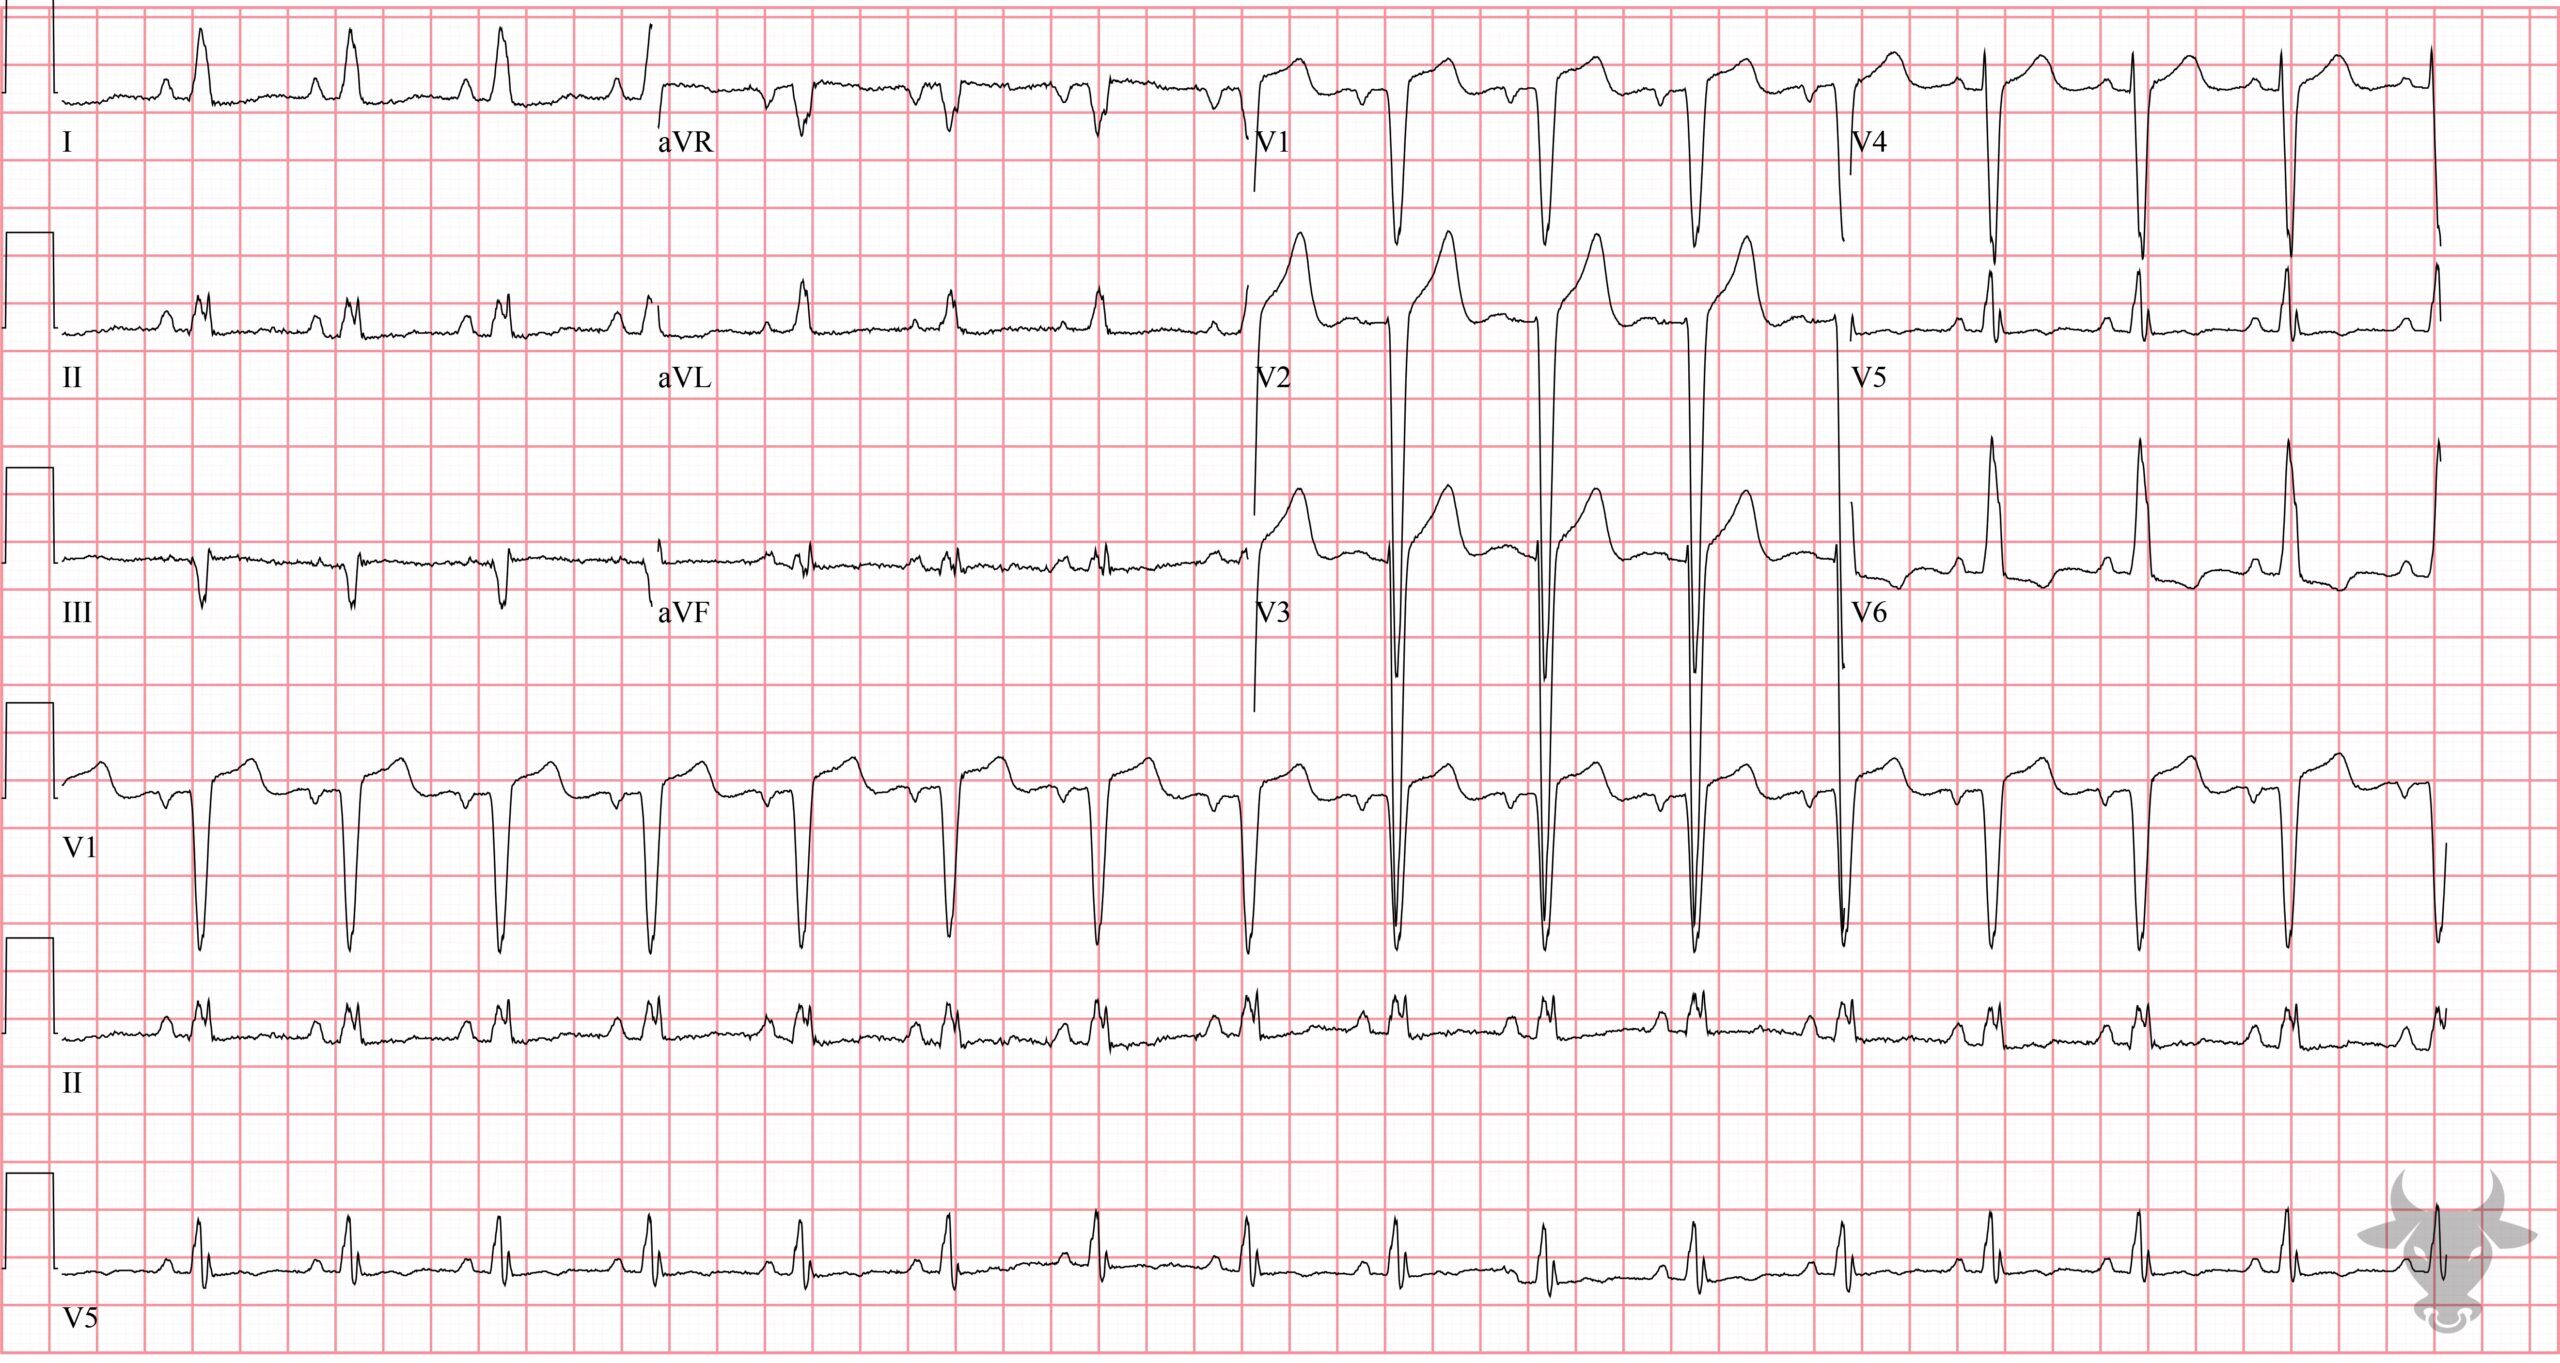
Left Ventricular Hypertrophy
Classic findings of left ventricular hypertrophy including large amplitude QRS complexes and associated repolarization abnormalities (e.g., asymmetric T-wave inversion in V6).